Every Ad Platform Grades Its Own Homework
Last Tuesday, a Shopify store pulled its ad reports from all five channels. Meta said they made $42K in revenue. Google said $38K. TikTok said $6K. The actual Shopify number? $31K. Somebody's math is off. Actually, everybody's math is off, just in different directions. And that's the problem with comparing multi-channel ad performance from inside each platform's own dashboard.
You're making budget decisions based on numbers that don't agree with each other. That's not a reporting problem. It's a visibility problem. You can't tell where your next dollar should go because every dashboard is grading its own homework. Almost every ecommerce operator spending on more than two paid channels has this.
The more platforms you add, the worse it gets.
Why You Can't Compare Ad Dashboards Side by Side
Here's what's actually happening behind those dashboards. Meta reports revenue using a 7-day click attribution window. Someone clicks your ad on Monday, buys on Saturday from a Google search, and Meta takes credit for that sale.
Google Ads counts a brand search as its own conversion. A customer sees your TikTok ad, Googles your store name, buys, and Google says it drove that sale.
TikTok uses a 1-day click window by default. It barely tracks anything beyond that. So conversions that TikTok actually started? They show up in another platform's dashboard.
Pinterest and X have their own windows and logic too. None of them are lying, exactly. They're just all using different rules to measure the same customer journey.
When you compare ROAS across these dashboards, you're comparing apples to brake pads. And that's how operators end up scaling the wrong channel for three months before they realize what happened.
How to Consolidate All Your Ad Channel Performance Into One Report
This is one of the things Superworker is good at, and it's probably the fastest version of this workflow you'll find.
Upload five CSV exports from your ad platforms into Superworker. One prompt. That's it. (And soon you won't even need the exports. Direct integrations with these tools are coming. Once they're live, you just connect the accounts and ask.)
You get back a single profitability report with every channel measured the same way: cost, revenue, sales, add-to-carts, net profit, CPA, reporting gap, profit per dollar spent, and ROAS. All calculated with the same math across all channels.
No formulas to build. No pivot tables. No switching between five browser tabs trying to reconcile numbers that were never meant to match.
A few seconds. One report. Clear picture of where to spend next.
What the Profitability Report Actually Showed (A Real Example)
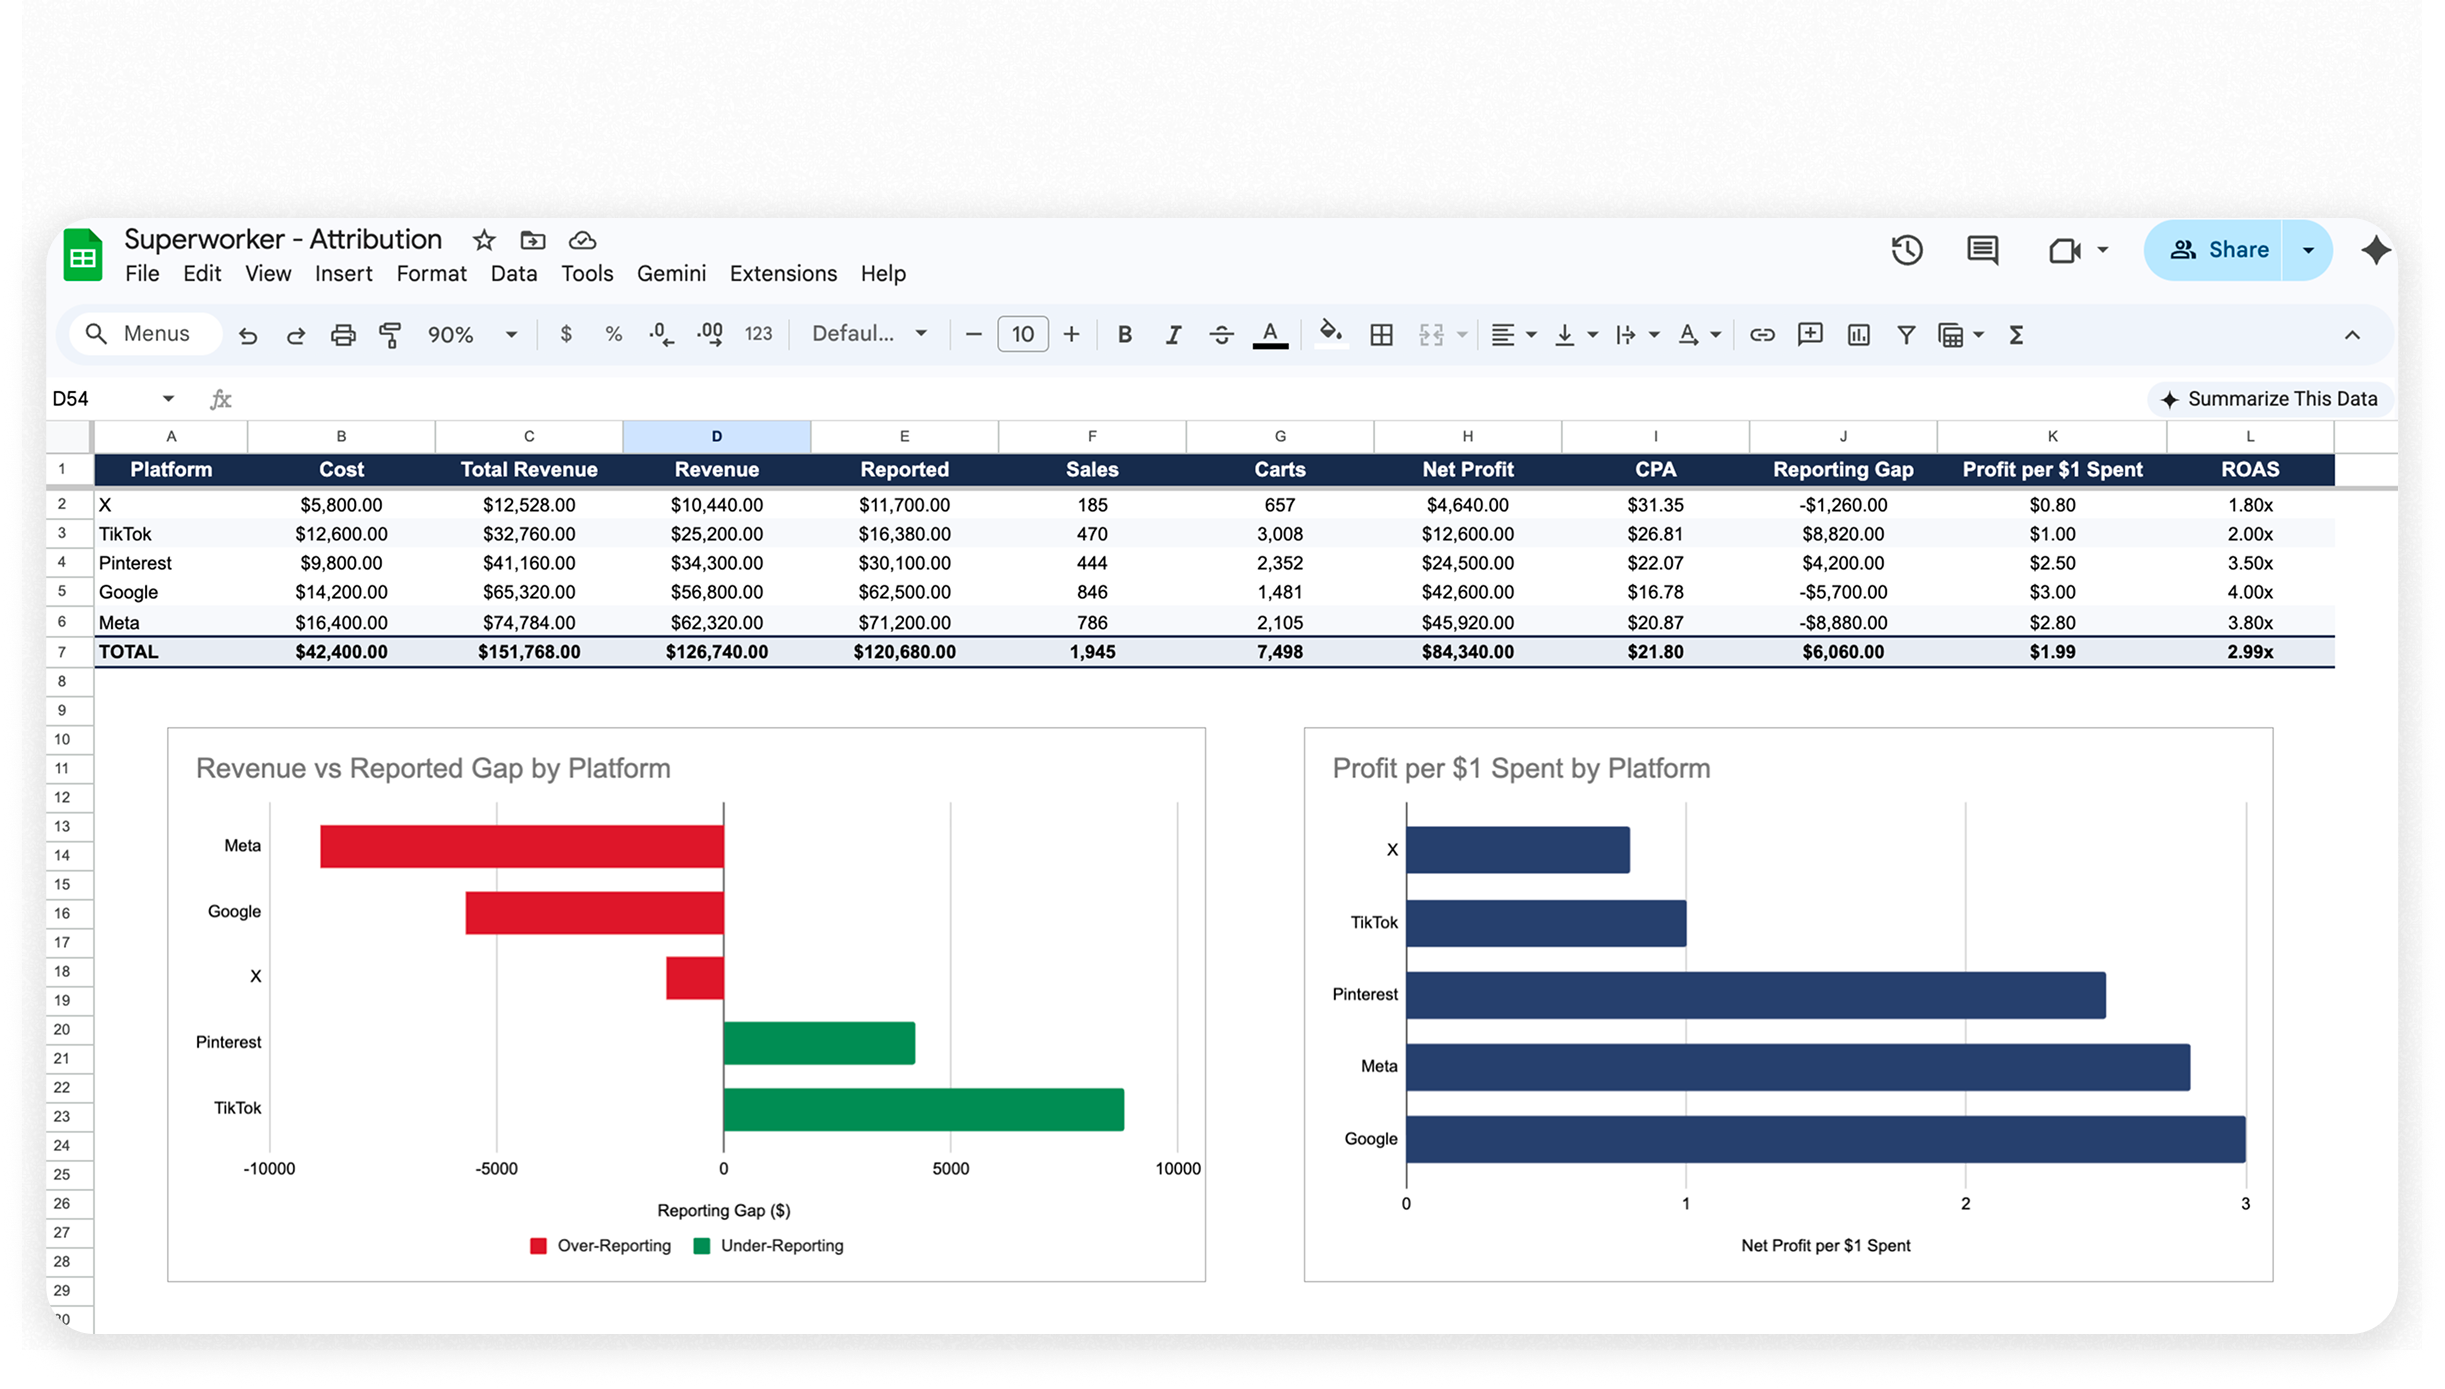
We ran this across five channels for a Shopify store spending across Meta, Google, TikTok, Pinterest, and X. Here's what the consolidated profitability analysis revealed.
Google and Meta drive volume, but both over-report
Meta over-reported revenue by $8,880. Google over-reported by $5,700. Both are strong channels, but their dashboards make them look better than they are. Without normalizing the numbers, you'd over-invest based on inflated returns.
TikTok's real impact is way bigger than TikTok shows
TikTok generated the most add-to-carts of any channel (3,008) but has the worst cart-to-purchase rate at just 16%. It gets people interested, but most of them don't convert inside TikTok's own ecosystem. Here's the interesting part: TikTok actually under-reports by $8,820. Its real contribution to downstream revenue is much larger than its own dashboard shows. The 1-day attribution window misses most of the action TikTok starts.
Pinterest is quietly strong
Pinterest performed at 3.5x ROAS and under-reported by $4,200. It's the kind of channel that looks mediocre in its own dashboard but looks solid when you measure everyone the same way.
X is the one to question
X returned $0.80 for every $1 spent. It converts the fewest of any channel at just 185 sales, has the highest CPA, the lowest return, and it over-reports on top of that. It's the only channel where profitability is genuinely questionable. Blended ROAS across all five channels: 2.99x That's the real number. Not Meta's number or Google's number. The actual blended return when every platform plays by the same rules.
Where Your Next Ad Dollar Should Go
This is the whole point. Not fixing attribution, but getting clear on where to put your next dollar based on real profitability across every channel.
Increase spend on Google. $3.00 profit per dollar spent. The numbers hold up even after correcting for over-reporting.
Hold Meta and Pinterest. Both are solid and stable. Meta's volume is real even if the exact revenue is inflated. Pinterest is quietly performing.
Question TikTok (but don't cut it). Low ROAS in isolation and only a 16% cart-to-purchase rate, but massive top-of-funnel intent. Those 3,008 add-to-carts are starting journeys that other channels are finishing (and taking credit for). TikTok is doing more work than it gets credit for.
Cut or seriously reduce X. Just 185 sales, the highest CPA, and the lowest return of any channel. The only one losing money. The numbers don't justify the spend.
Why This Matters for Ecommerce Ad Spend
This isn't about having better charts or a prettier dashboard. It's about not finding out three months later that you were scaling the wrong channel because each platform told you a different story.
If you're a Shopify merchant or an agency managing ad spend across multiple channels, you've probably made at least one budget call based on numbers that didn't agree with each other. That's the cost of fragmented reporting: not a data problem, but real dollars going to the wrong place.
One report. Same math. Real profitability numbers. You know where the next dollar goes.
If you've already asked yourself "is my ROAS even real?", this is the next step: seeing all your channels side by side and knowing exactly where to spend, hold, and cut.
FAQ:
Q: Why can't I just compare ROAS across ad platforms for my Shopify store? Each platform uses different rules to claim credit for a sale. Meta uses a 7-day click window, Google counts brand searches, TikTok only tracks 1 day. So a "3x ROAS" in Meta and a "3x ROAS" in Google aren't measuring the same thing. You need to pull the data out of those dashboards and measure everything with the same math before you can actually compare.
Q: How do I compare ad performance across Meta, Google, and TikTok? Export your ad data from each platform as a CSV. Consolidate everything into one report with the same math: same revenue calculation, same cost structure, same profitability metrics. Superworker does this automatically when you upload your exports and ask for a cross-channel comparison.
Q: What's a good blended ROAS for Shopify stores? It depends on your margins, but most healthy Shopify stores aim for 2.5x to 4x blended ROAS across all channels. The key word is "blended" and measured the same way. A 3x ROAS from one platform's dashboard is meaningless if every platform is using different math.
Q: How often should I run a cross-channel profitability report? At minimum, weekly if you're actively scaling spend. Monthly if you're in maintenance mode. The goal is catching misallocated budget before it compounds. One wrong call on channel mix can cost you thousands over a quarter.