Another week, same ritual. Open Meta Ads Manager, screenshot the ROAS. Open Google Ads, screenshot the ROAS. Drop both into Slack. "Great week, team."
But here's what nobody checks: do those numbers actually add up against Shopify? They could be higher. They could be lower. The point is, you're making budget decisions on a number you've never verified.
We ran this exercise for a skincare DTC brand spending about $8,750/week across Meta and Google. The results weren't what anyone expected.
What Meta and Google Reported vs. What Shopify Actually Showed
Meta reported $13,546 in revenue. Google reported $26,840. Combined, that's $40,385 at a 4.61x blended ROAS. Healthy numbers. The kind you'd screenshot for your investor update.
Then we looked at Shopify.
Actual net sales for the same week: $48,277. That's $7,891 MORE than both ad platforms claimed combined.
In this case, the platforms weren't inflating. They were missing revenue. The gap shifts week to week depending on attribution windows, campaign mix, and how many customers touch multiple channels before buying.
The problem isn't just the direction. It's that the gap exists and nobody's checking.
Where the Shopify Attribution Gap Comes From
375 Shopify orders that week had zero attribution from either Meta or Google. That's 36% of all orders. They came from organic search, direct traffic, email, repeat customers typing the URL, word of mouth, dark social. All the channels ad dashboards can't see.
Saturday was the worst gap. Shopify recorded $7,882 in sales. Meta and Google combined claimed $5,493. Nearly $2,389 in revenue that nobody took credit for.
The daily breakdown tells the full story:
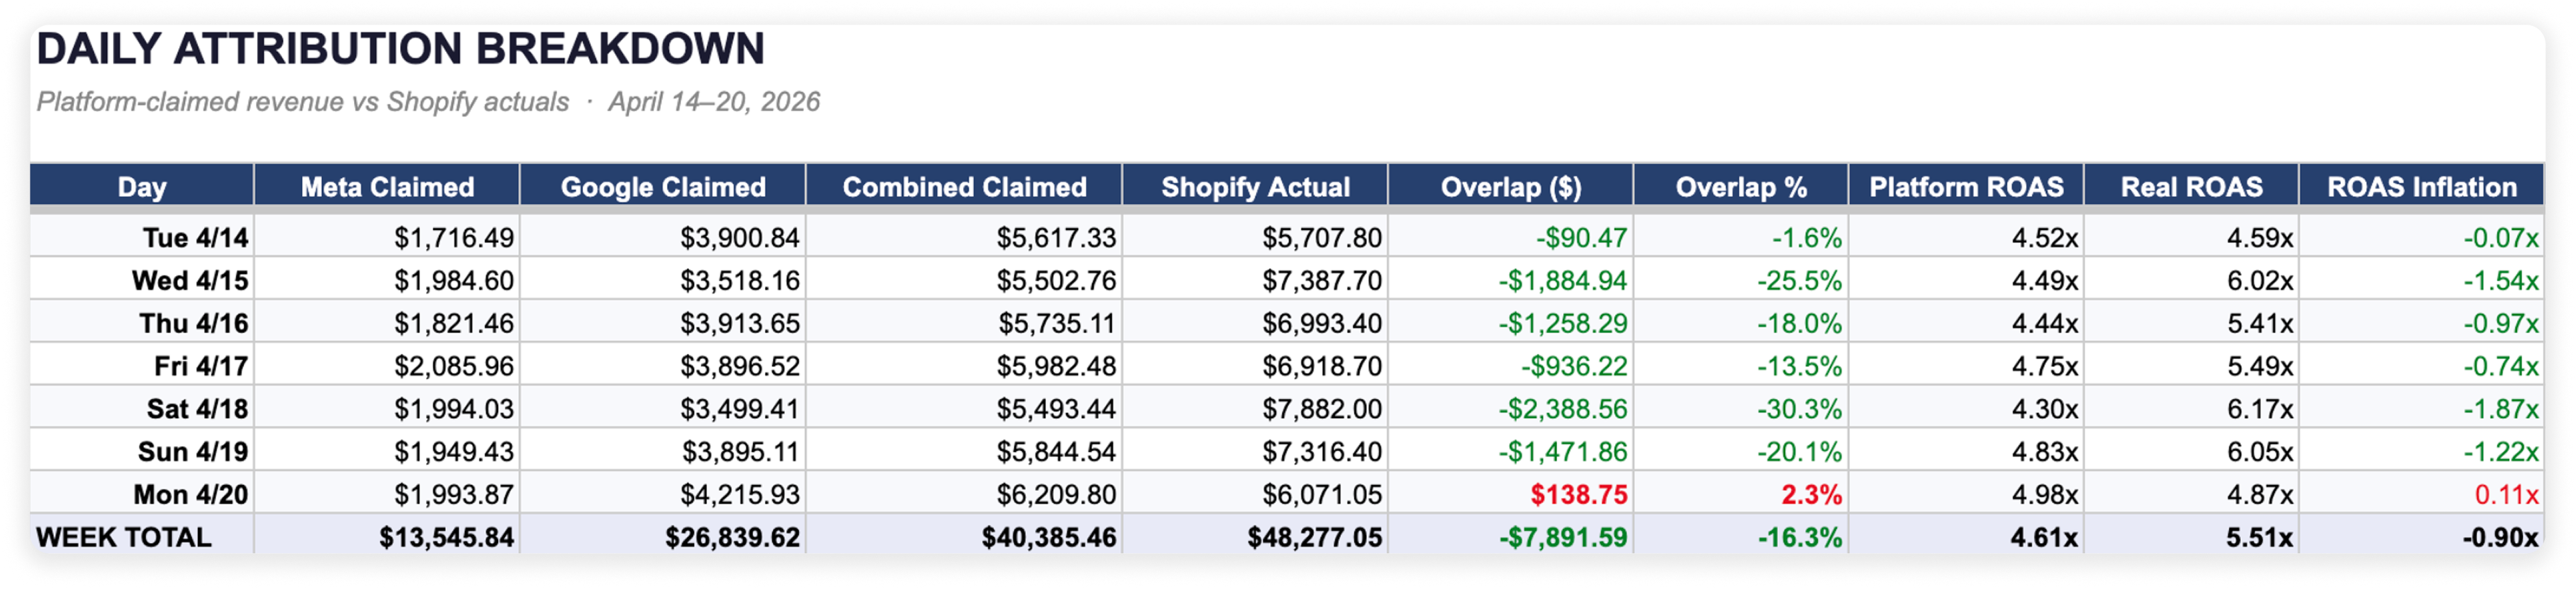
Only one day (Monday) had platforms over-claiming, and by just $139. Every other day, they under-reported.
The takeaway isn't "your dashboards are too low" or "your dashboards are too high." It's that the number moves, and you can't see it unless you check.
How the ROAS Gap Affects Every Budget Decision
Platform-reported blended ROAS: 4.61x. Shopify-based ROAS: 5.51x. A gap of 0.90x.
That gap could shift depending on the week. And every budget decision you make, whether to scale, cut, or shift ad spend, is based on whichever number you happen to look at.
Scale a campaign because Meta says 5x ROAS, but Shopify says 3.5x? You're burning cash. Cut a campaign because Google says 2x ROAS, but the organic revenue it fuels doesn't show up in any dashboard? You just killed a channel that was quietly working.
You can't make the right call without knowing the real number. And the real number lives in Shopify, not in the ad platforms.
Google Brand Search ROAS: The Murkiest Number in Your Dashboard
Google Brand Search reported a 9.26x ROAS that week. Looks incredible on paper. But how many of those buyers searched the brand name because they saw a Meta ad first? Google claims the sale. Meta doesn't. Neither dashboard tells you the full story.
This is why comparing ad platform revenue to Shopify net sales matters. Shopify doesn't care which ad gets credit. It just records what actually sold. When you're running both Meta prospecting and Google brand campaigns, the only source of truth for your real ROAS is your store.
How We Checked Our Shopify ROAS in One Prompt
We uploaded the Meta and Google Ads exports alongside the Shopify data and typed one line: "Compare Meta and Google reported revenue vs my actual Shopify net sales for April 14-20. Show me blended ROAS from platforms vs real ROAS from Shopify, and how much revenue is double-counted."
Superworker pulled the numbers from all three files, matched the date ranges, and built the full attribution breakdown. Daily comparison, gap percentages, the real ROAS, and a chart. Took about 30 seconds.
No BI tool. No data warehouse. No $2,000/month attribution vendor. Just your exports and one prompt.
Go Deeper: Order-Level Matching, Trend Tracking, Budget Reallocation
What we showed here is a weekly snapshot. One prompt, one answer. But the same data can answer harder questions.
Order-level matching. Cross-reference individual Shopify orders against Meta's claimed purchases and Google's conversions by timestamp and amount. Flag which specific orders are being double-claimed and which are orphans. That's 30 minutes of analyst work in one prompt.
Weekly trend tracking. Upload exports every Monday and compare the Shopify attribution gap across 4, 8, 12 weeks. Is the gap widening? Are your organic channels growing or shrinking? Is a specific campaign consistently over-claiming? Superworker already connects directly to your Shopify store, and Meta and Google Ads integrations are coming soon. Once those are live, you won't even need the exports. Just ask.
Budget reallocation modeling. Once you know the real ROAS by channel, the next question is obvious: where should the next dollar go? Use the actual Shopify numbers, not platform-reported numbers, to model what happens if you shift 20% from Google Brand Search to Meta prospecting.
Each of these is one prompt. Your data, your exports, your answer.
FAQ: Meta Ads vs Shopify Attribution
Q: How often should I compare my Shopify ROAS to ad platform ROAS? Weekly, at minimum. The gap shifts depending on your campaign mix, attribution windows, and how much organic or repeat traffic you're getting. A single week can look fine while a trend over 4-8 weeks reveals a persistent mismatch.
Q: How often should I compare my Shopify ROAS to ad platform ROAS? Because each platform uses its own attribution model. Meta credits sales to anyone who clicked or viewed an ad within its attribution window. Google does the same with its own window. Neither sees organic search, direct traffic, email, or repeat buyers who didn't come through an ad. Some orders get claimed by both platforms (double-counting), and some get claimed by neither (orphaned orders).
Q: What's the difference between platform ROAS and blended ROAS from Shopify? Platform ROAS uses each ad platform's self-reported revenue divided by ad spend. Shopify-based blended ROAS uses your actual net sales divided by total ad spend across all platforms. The Shopify number is the one your P&L actually reflects.
Q: What is a good blended ROAS for a Shopify store It depends on your margins, but most DTC brands target 3x-5x blended ROAS as healthy. The more important question is whether you're calculating it from ad platform numbers or actual Shopify net sales. A 4.61x platform ROAS vs a 5.51x Shopify ROAS tells two very different stories about your business.
Q: Why don't Meta and Google Ads revenue match my Shopify sales? Because each platform uses its own attribution model. Meta credits sales to anyone who clicked or viewed an ad within its attribution window. Google does the same with its own window. Neither sees organic search, direct traffic, email, or repeat buyers who didn't come through an ad. Some orders get claimed by both platforms (double-counting), and some get claimed by neither (orphaned orders).